Monthly Outlook - August 2025
Share


MONTHLY OUTLOOK
USDINR Fundamental
The Indian Rupee ended July at 87.5975 against the US Dollar, weakening by 0.2% over the month. This modest depreciation masks the underlying macroeconomic and geopolitical headwinds pressuring the currency. Chief among them was U.S. President Donald Trump’s aggressive trade stance, including a proposed 25% tariff on Indian exports and an unspecified penalty linked to India’s ongoing defence and energy ties with Russia. These developments dented investor confidence and triggered capital outflows. Compounding the pressure was continued volatility in global crude oil prices amid Middle East tensions, raising India’s import bill and widening its current account concerns. In the backdrop, foreign portfolio investors withdrew over $1.8 billion from Indian equities and debt in June, with the outflows spilling over into July.
On the global front, the US Federal Reserve maintained its policy rate at 4.25–4.5% in July, but hawkish remarks from Fed Chair Jerome Powell dampened expectations of a near-term rate cut. Strong U.S. labor market data and firm Treasury yields supported the dollar, thereby weakening the rupee further. With the rupee down 2.4% in FY26 so far, it continues to underperform its Asian peers. Looking ahead, the rupee may remain under pressure amid global risks and dollar strength with focus now on the RBI MPC’s upcoming decision. However, Trump noted that trade negotiations with India are still ongoing, and any positive development could offer temporary relief to the rupee.
USDINR Technical
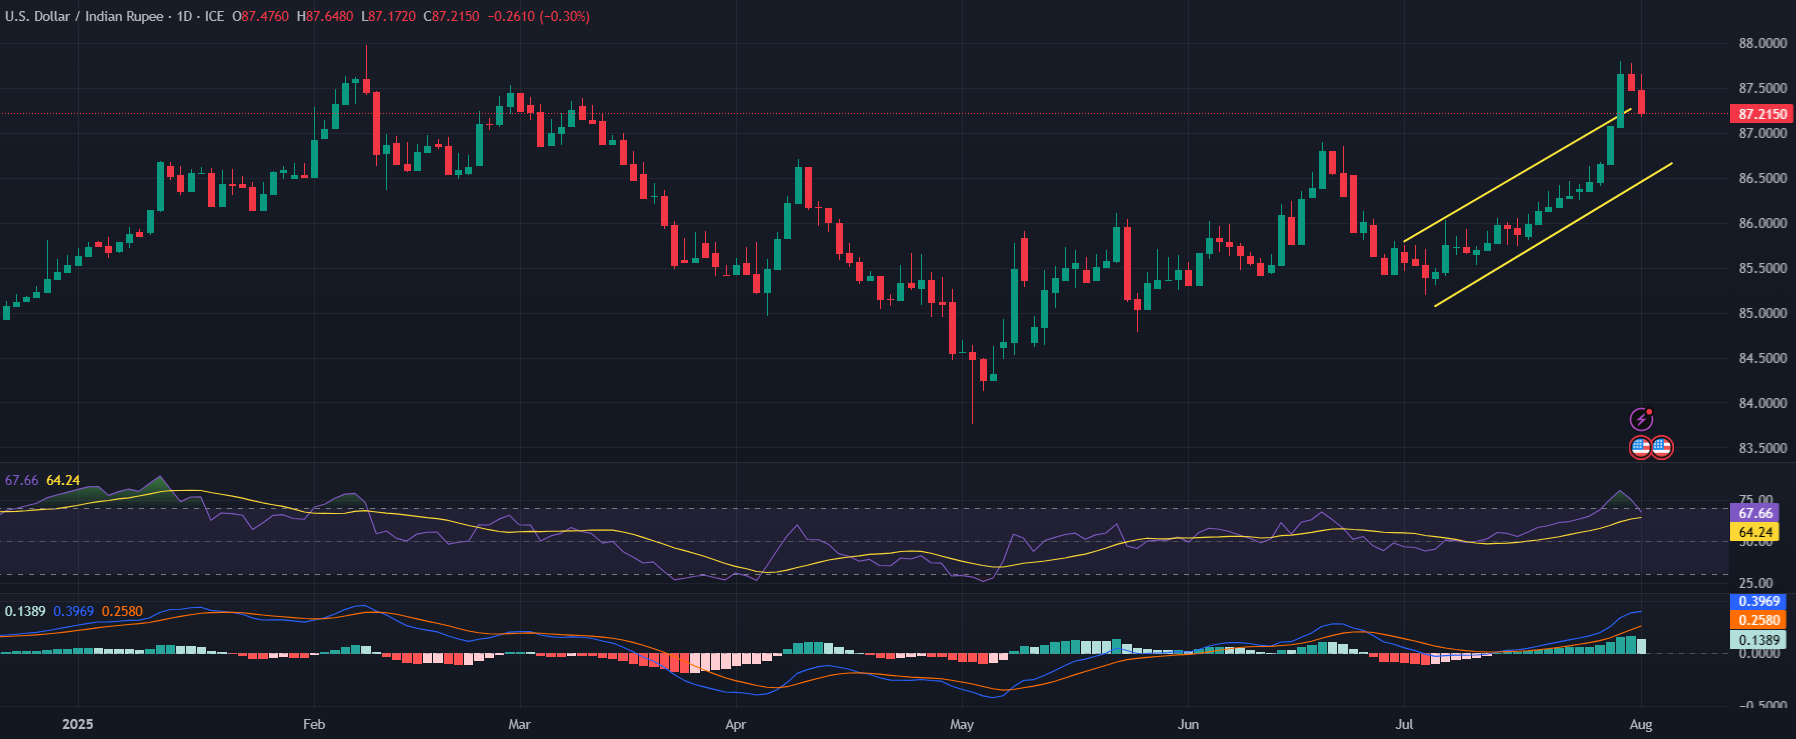
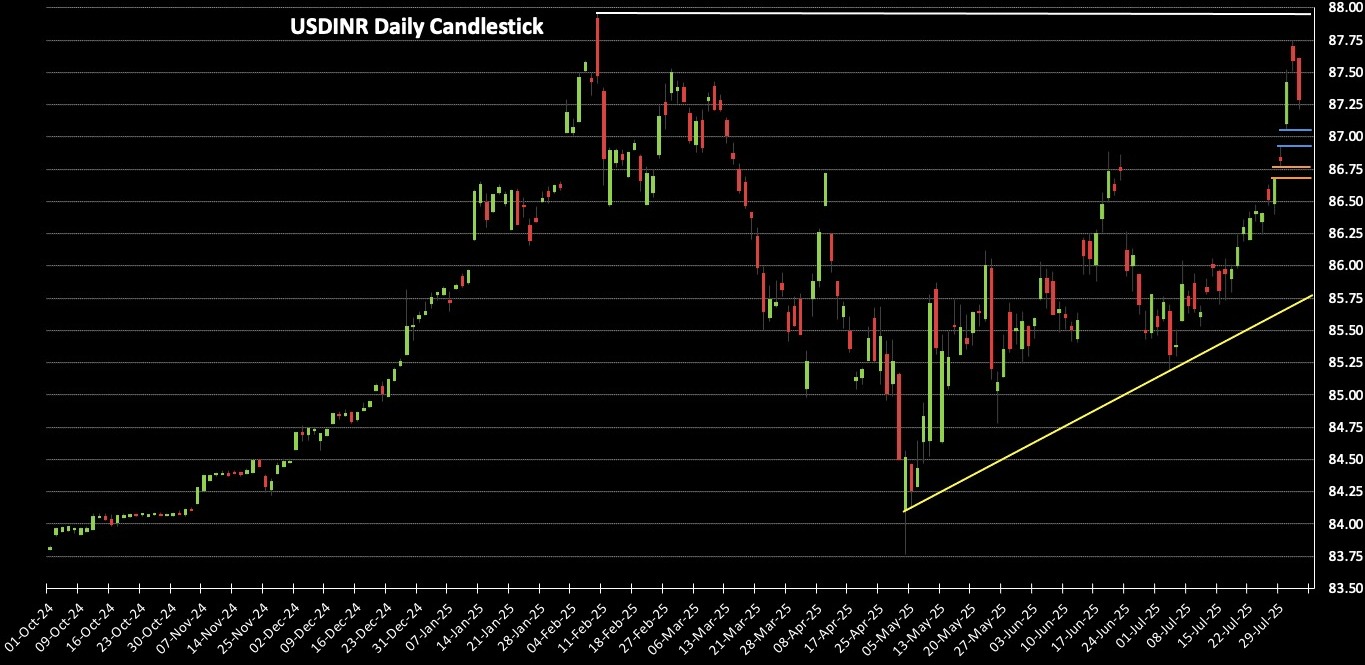
The USDINR pair this month showed a pure upward trend as it rose by 2.47% for the July month. It started the month down at 85.61 but closed significantly higher at 87.5975. The dollar index strengthened on diminishing chanced for future rate cuts which even dropped below 40bps for the entire 2025. 2 new gaps are formed in the last week of the month, first gap of 17.00 paisa from 86.67-86.84(orange horizontal lines) though the gap was partially filled during the session only and the next gap of 7.25 paisa from 86.9275-87.10(blue horizontal lines) was seen in the subsequent trading session and then the USDINR remained strong towards the end of the month.
As per the daily-frame chart, the previously identified upward trend channel has broken this week to hit a 5.5 month high of 87.75, very close to the pair’s all-time high level of 87.9575. The month-old down gap around 87.23-87.12(formed in march) was also filled and on contrary as mentioned above 2 news gaps are formed this week which are currently down as per the current spot price which means that the pair can inch down to fill those gaps. The momentum indicators are also showing signs that the currency is in overbought territory and a reversal could be possible. The resistance continues to be the all-time high level of 87.9575 whereas initial support lands around the upper limit of first gap i.e. 87.10.
All the exporters are advised to not miss this opportunity and should increase their hedge ratio at 87.25+ levels to around 50-60% at least as it is less likely that the pair will form a new all-time high. Diversify your portfolio by using options also with forwards. On the other hand, importers to stay put for now and wait for a significant reversal.
EURUSD Fundamental
The euro finished the month near a four-year peak, ending at 1.1786 after briefly touching 1.1788 the same day, marking a robust monthly gain of 3.88% and its sixth consecutive monthly advance. The EURUSD traded higher through June as a combination of eurozone resilience and broad dollar weakness shaped sentiment. The euro drew support from improving labor market data and speculation that the ECB may pause its easing cycle after cutting rates to 2.15%, while ECB President Lagarde reaffirmed a commitment to stability. However, poor trade balance figures, weak industrial production, and political uncertainty around the French elections weighed on the currency at times. Meanwhile, the dollar softened under pressure from weaker U.S. manufacturing data, cooling CPI prints, and President Trump’s criticism of the Fed, which fueled expectations of a rate cut and raised questions about central bank independence. Additional relief from geopolitical tensions, including a ceasefire in the Middle East, reduced safe-haven flows and further undermined the dollar. Looking ahead, July’s market will closely watch the Fed and ECB policy meetings along with key economic indicators to gauge whether this upside momentum in EURUSD can sustain.
EURUSD Technical
The EURUSD pair began the month near its low at 1.1350 but displayed robust bullish momentum, climbing steadily to reach a high of 1.1788 on the final trading day—its highest level since September 2021. The pair closed the month firmly above 1.1700, signaling strong buying interest after decisively breaching key resistance levels at 1.1575 (R1) and 1.1631 (R2). This upward move highlights sustained investor confidence, underpinned by the Eurozone’s resilient economic performance. Meanwhile, the U.S. dollar weakened noticeably, with the dollar index dipping below 97 amid uncertainty surrounding possible leadership changes at the Federal Reserve. Technically, the 14-day RSI remains elevated at 71, suggesting that bullish momentum could face a near-term pause due to overbought conditions. A continued decline in the dollar could confirm a breakout above the long-established 1.1400–1.1500 range, opening the door for further upside. For now, immediate support is seen around 1.1400, near the 50-day SMA, which has provided a reliable floor during previous corrections, including April’s reversal.
.png)
GBPUSD Fundamental
The GBPUSD pair declined this month, opening at 1.3731 and closing nearly 4% lower at 1.3279. Initially supported by broad-based US dollar weakness due to uncertainty around US trade negotiations and a $3.3 trillion debt increase from Trump’s tax-cut bill, the pound soon faced pressure from rising UK fiscal and political uncertainties, including speculation over tax hikes and Prime Minister Starmer’s ambiguous stance on Finance Minister Reeves. UK GDP contracted by 0.3% and 0.1% in consecutive months, driven by declines in industrial and construction activity, while unemployment rose to 4.7% and wage growth slowed to 5.0%. US dollar strength was bolstered by new tariffs, hawkish Fed minutes, and strong US retail sales, reducing expectations for near-term rate cuts. Despite a UK-India trade deal boosting exports, weak UK retail sales, a contracting Manufacturing PMI, and anticipated BoE rate cuts in 2025 kept the pound subdued. Looking ahead, the focus shifts to the Bank of England’s interest rate decision next week.
GBPUSD Technical
The GBPUSD pair reversed its five-week bullish trend, posting a sharp monthly decline of 3.85% in July. The daily chart reflects sustained bearish momentum, highlighted by consecutive red candles and the formation of a descending channel, indicating persistent selling pressure. On the final trading session of the month, the pair broke below a descending triangle pattern, confirming a bearish continuation setup. If the downtrend extends, immediate support is seen at 1.3232 (previous horizontal support). A breach of this level could open the door towards the 200-day EMA at 1.3132, a critical support zone that may cushion further losses. The overall structure remains negative, and unless a reversal pattern emerges, the bias remains downward. Importers are advised to initiate short-term hedges near the mentioned support zones, while exporters may await a corrective rebound to enter at more favourable levels.
.png)
USDJPY Fundamental
The USDJPY pair went through big ups and downs in July and ended the month at 147.380, down 2.61%. Early in the month, Japan’s Prime Minister Ishiba’s coalition lost its majority in the upper house, winning only 47 of the 50 seats needed. This led to political uncertainty, which put pressure on the yen. However, the pair found support after the U.S. and Japan signed a trade deal. Tariffs on Japanese cars and other goods were cut from 25% to 15%, and Japan agreed to invest $550 billion in the U.S. The deal also opened Japan’s markets to U.S. products like cars, rice, and farm goods. BoJ kept its interest rate steady at 0.50% and continued its easy-money policy. But it raised its 2025 inflation forecast from 2.2% to 2.7%, suggesting it might raise rates if inflation stays high. Later in July, U.S. data showed that the economy grew at a strong pace, Q2 GDP rose 3.0% after a 0.5% drop in Q1. Inflation stayed firm, as shown by the PCE Price Index, and solid job numbers lowered the chances of the Fed cutting rates in 2025. Looking ahead, the USDJPY pair seems set for gains in August. Strong U.S. growth, steady inflation, and the positive trade deal are all supportive for the dollar. Meanwhile, Japan’s loose monetary policy and ongoing political concerns could keep the yen weak. Any shifts in BoJ’s stance, especially if inflation accelerates, could impact the yen’s value.
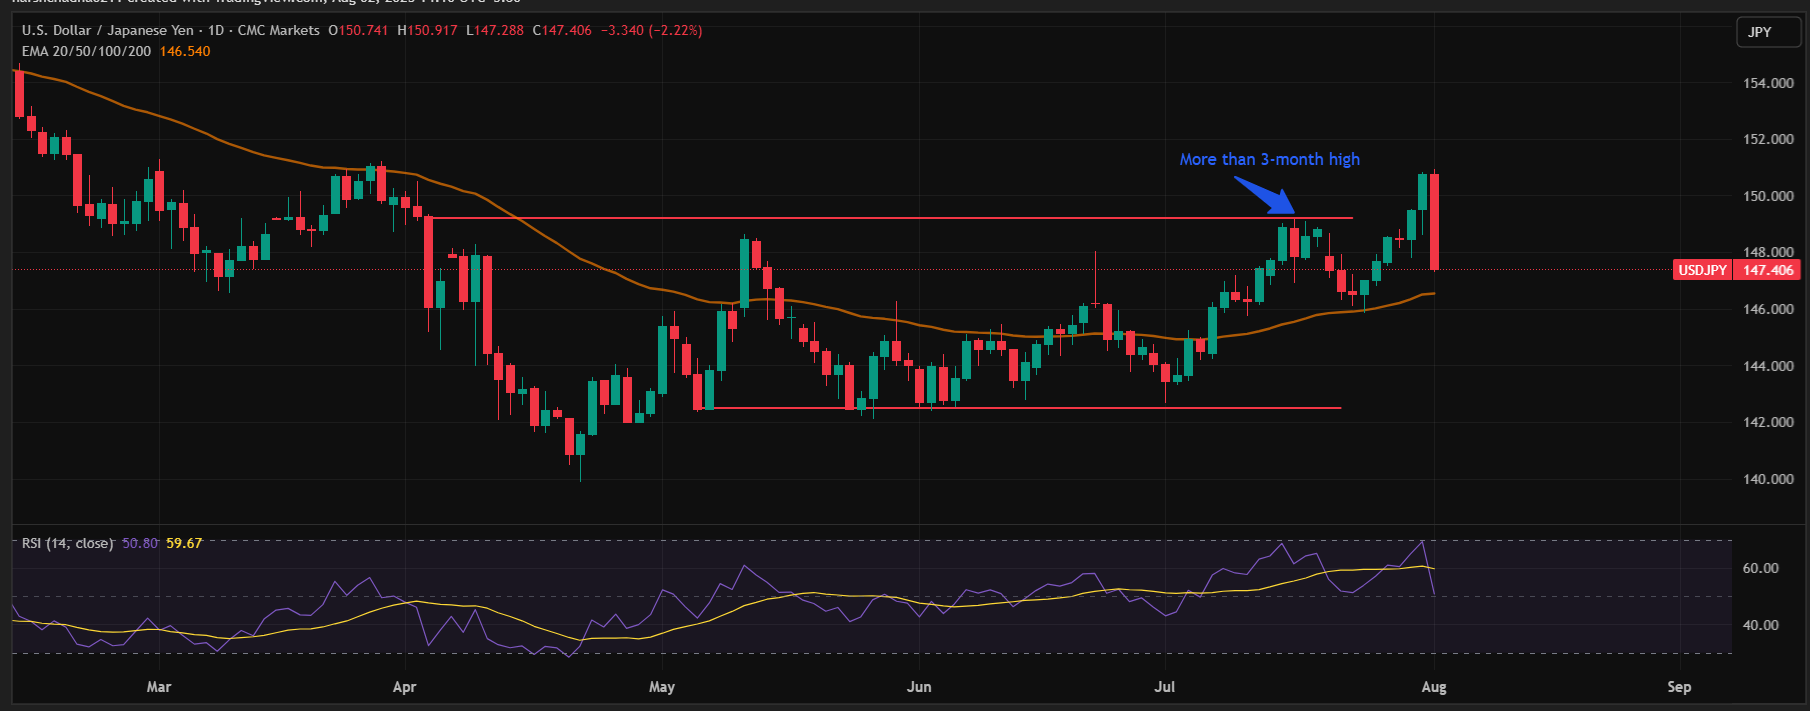
USDJPY Technical
USDJPY opened the month around 144 and rallied to a four-month high of 150.84, reflecting a strong dollar rebound after the U.S. announced a 15% tariff on Japanese goods—easing market uncertainty. Early yen strength was driven by a weaker U.S. dollar amid speculation over leadership changes at the Federal Reserve. However, compared to other majors, the yen’s gains were limited, as the Bank of Japan maintained a cautious stance, initially wary of trade tensions affecting recovery. That view shifted after the BoJ meeting this month, which signaled confidence in the economy. Technically, the 145.00–146.00 zone continues to offer strong support. The pair reclaimed the 200-day EMA near 148, reinforcing bullish momentum. As long as USDJPY stays above the 50-day EMA, dips are likely to be bought. A sustained move above 150 could open the door toward 151+, while consolidation above 146–148 provides a solid base for further upside.
Share

Recent Blog


Ready to make smarter forex decisions?
Get timely market updates straight to your inbox and WhatsApp.